Light enters tissue
The optical source illuminates the finger while arterial blood volume changes with every pulse.
KardioAS P records the peripheral pulse optically from a finger sensor and turns the waveform into a reusable study: live PPG, pulse-to-pulse intervals, PRV, pulse-wave morphology, pattern screening, physiological profiles, trends and structured reports.
PPG is not an ECG signal. It observes the mechanical/peripheral consequence of each cardiac cycle through changing blood volume in tissue.
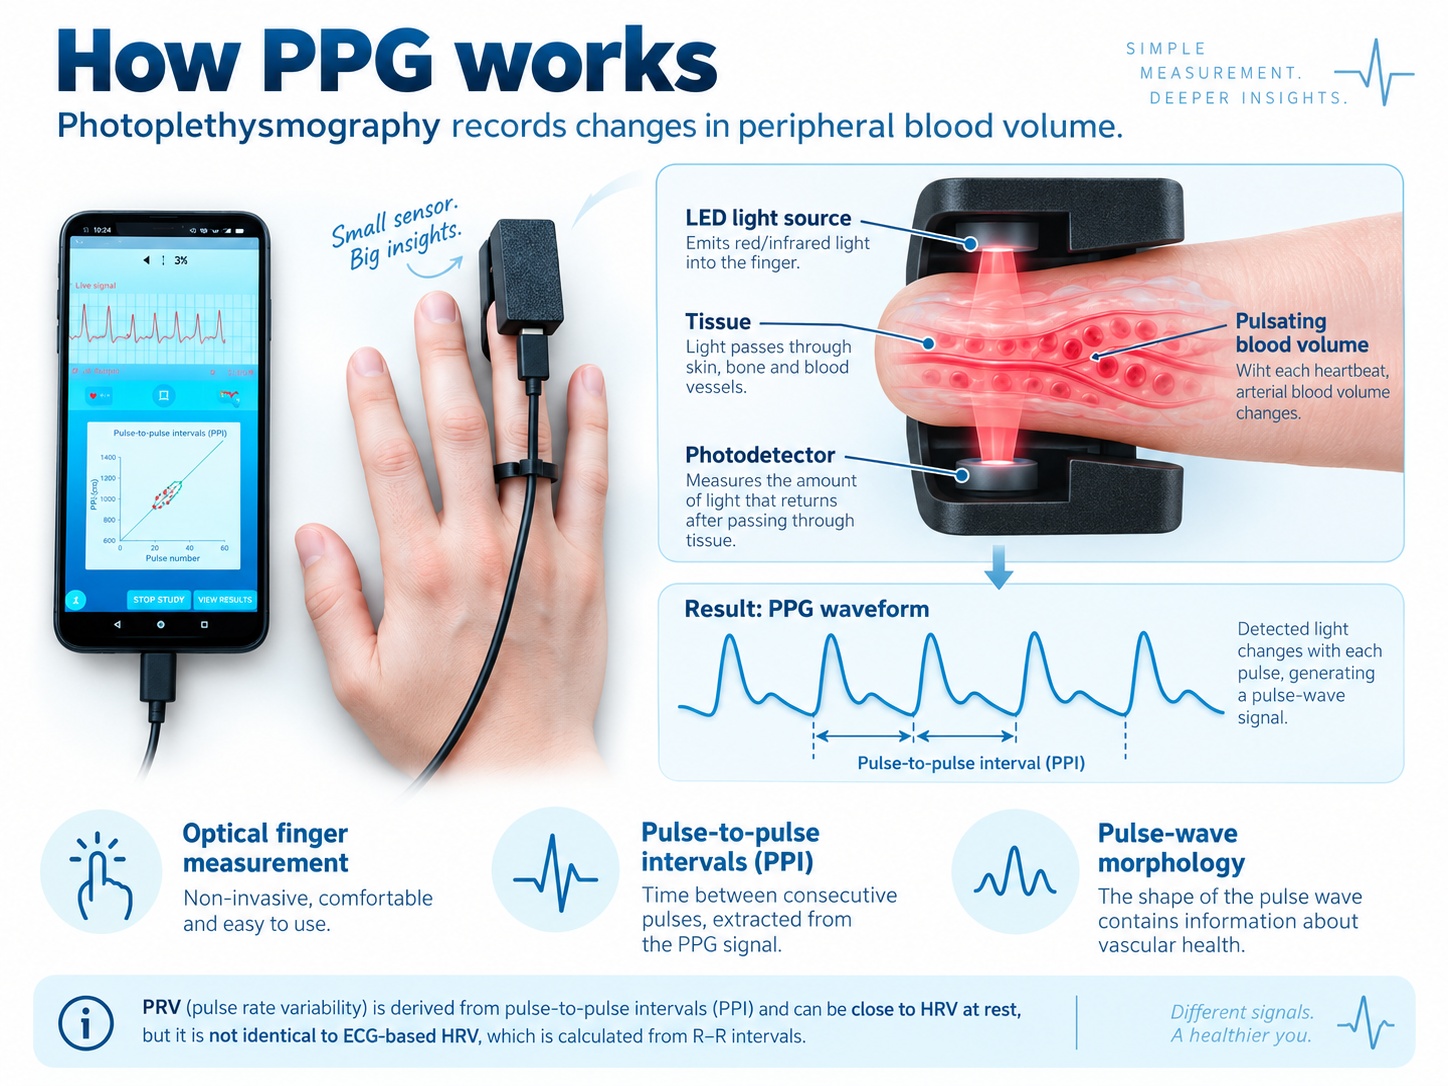
Photoplethysmography (PPG) uses light to detect small beat-by-beat changes in blood volume in peripheral tissue. The sensor does not record the heart's electrical field; it records the pulse wave after the cardiac contraction has propagated through the arterial system to the measurement site.
That distinction is the reason KardioAS P can study both when pulses arrive and how each pulse is shaped. Timing becomes PPI/PRV data, while the contour itself becomes a source for morphology analysis.
The optical source illuminates the finger while arterial blood volume changes with every pulse.
The photodetector measures pulse-synchronous changes in transmitted or reflected light.
Consecutive pulse landmarks create pulse-to-pulse intervals for PRV and rhythm analysis.
The waveform contour remains available for morphology, reflected-wave and vascular-context analysis.
The practical setup is intentionally simple. A compact finger PPG sensor is connected to the Android device, the live waveform is checked, and the recording is saved to the selected patient. From there, the same study opens into analysis, comparison and reporting without changing systems.
Why this matters: no chest electrodes are needed for the PPG workflow, and the person can remain comfortably seated or lying down while the phone is handled by the user, practitioner or caregiver.
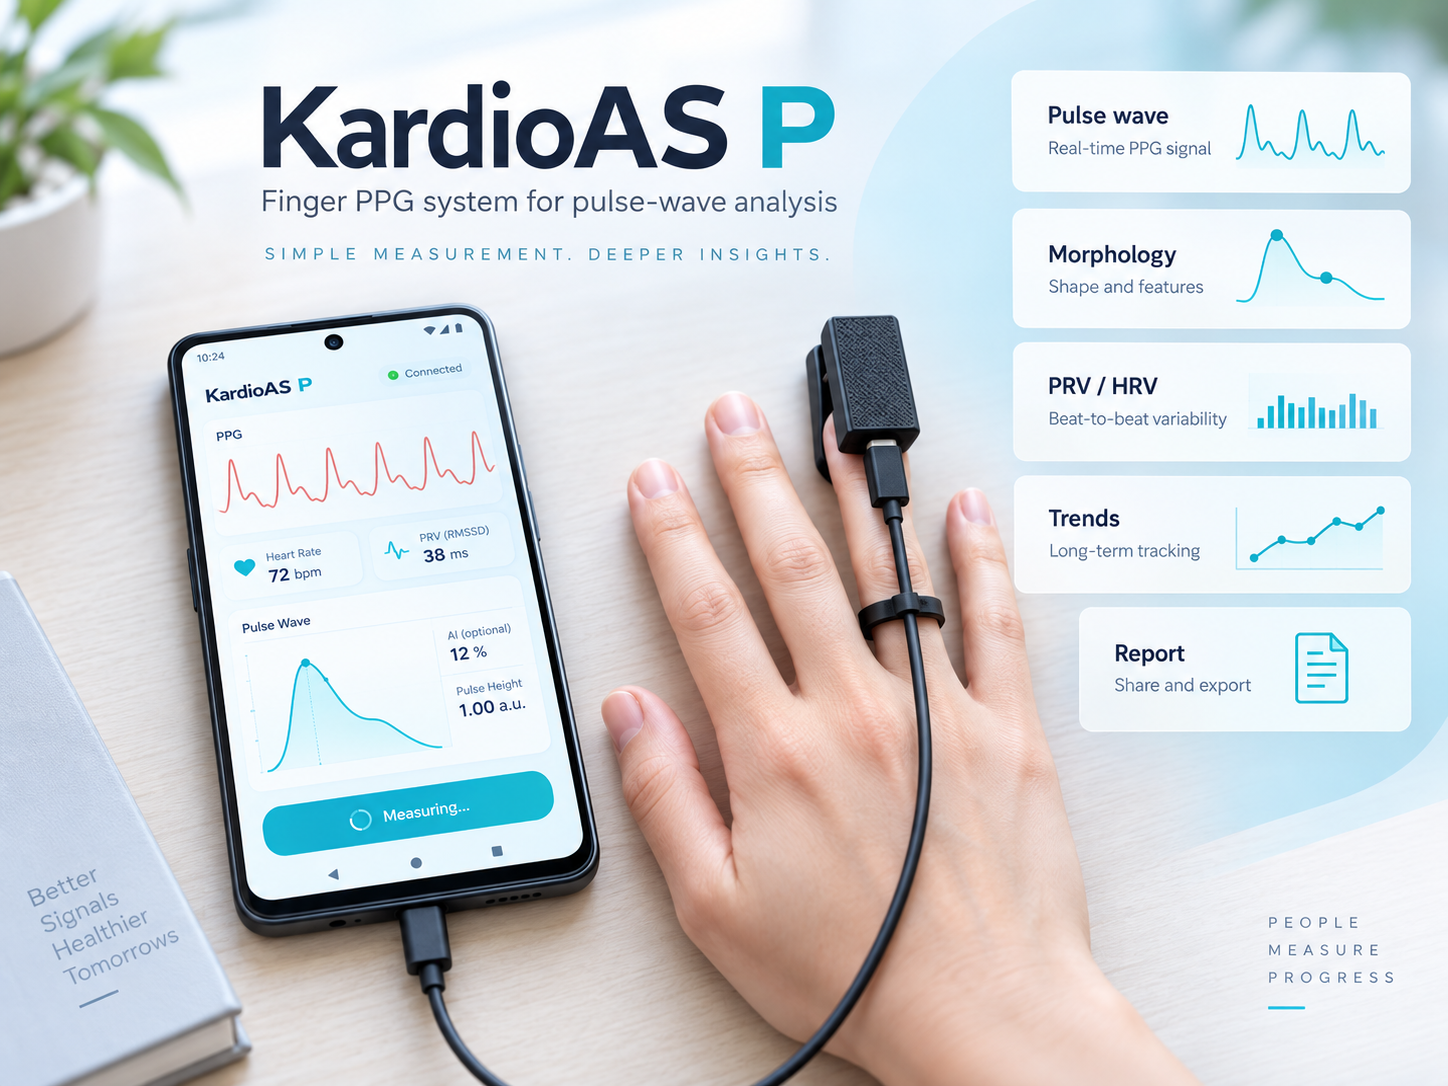
The strength of KardioAS P is not one isolated metric. It keeps the original peripheral pulse signal connected to morphology, variability, pattern screening, physiological context and repeated-study follow-up.
See the live peripheral waveform, contact quality, heart rate and pulse interval during acquisition.
Build a representative pulse contour and identify Foot, P1, dicrotic notch and reflected P2 structure.
Time-domain, nonlinear, Poincaré and spectral PRV metrics remain linked to the same recorded study.
Registry, trends, calendar, before/after comparison and reports turn measurements into longitudinal observation.
The recorder keeps the most important information visible: the live wave, heart rate, pulse interval, signal quality, stable-contact indication and study timer. The application also supports eight interface languages.
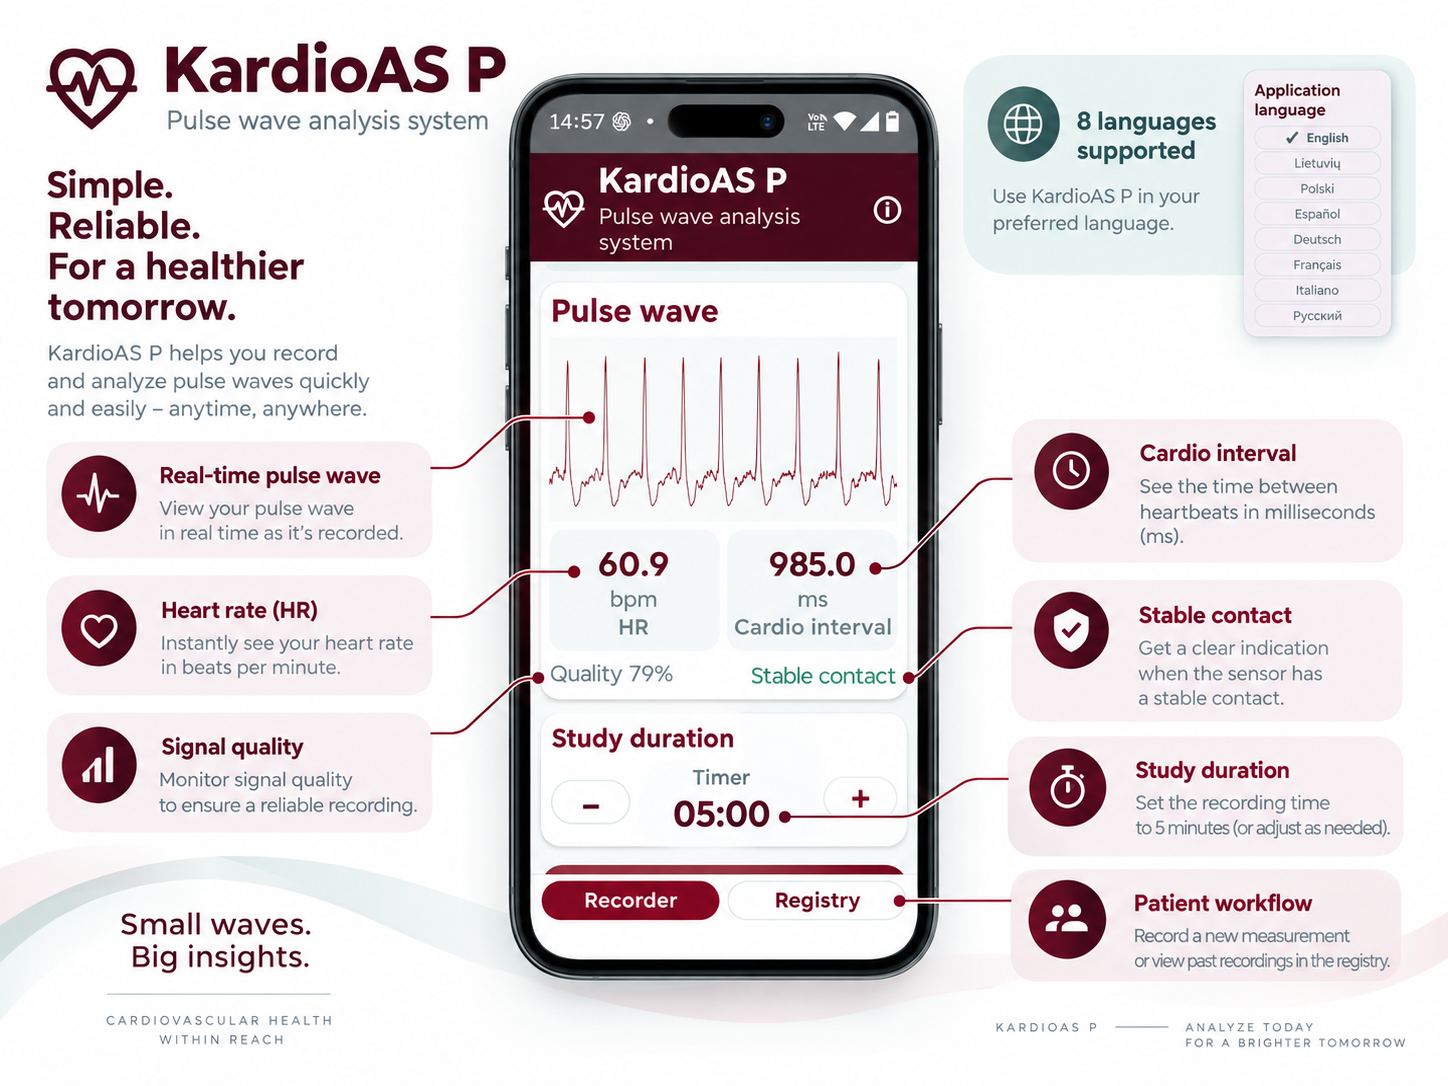
Live signal and contact feedback make it easier to recognize whether the measurement conditions are suitable before relying on analysis.
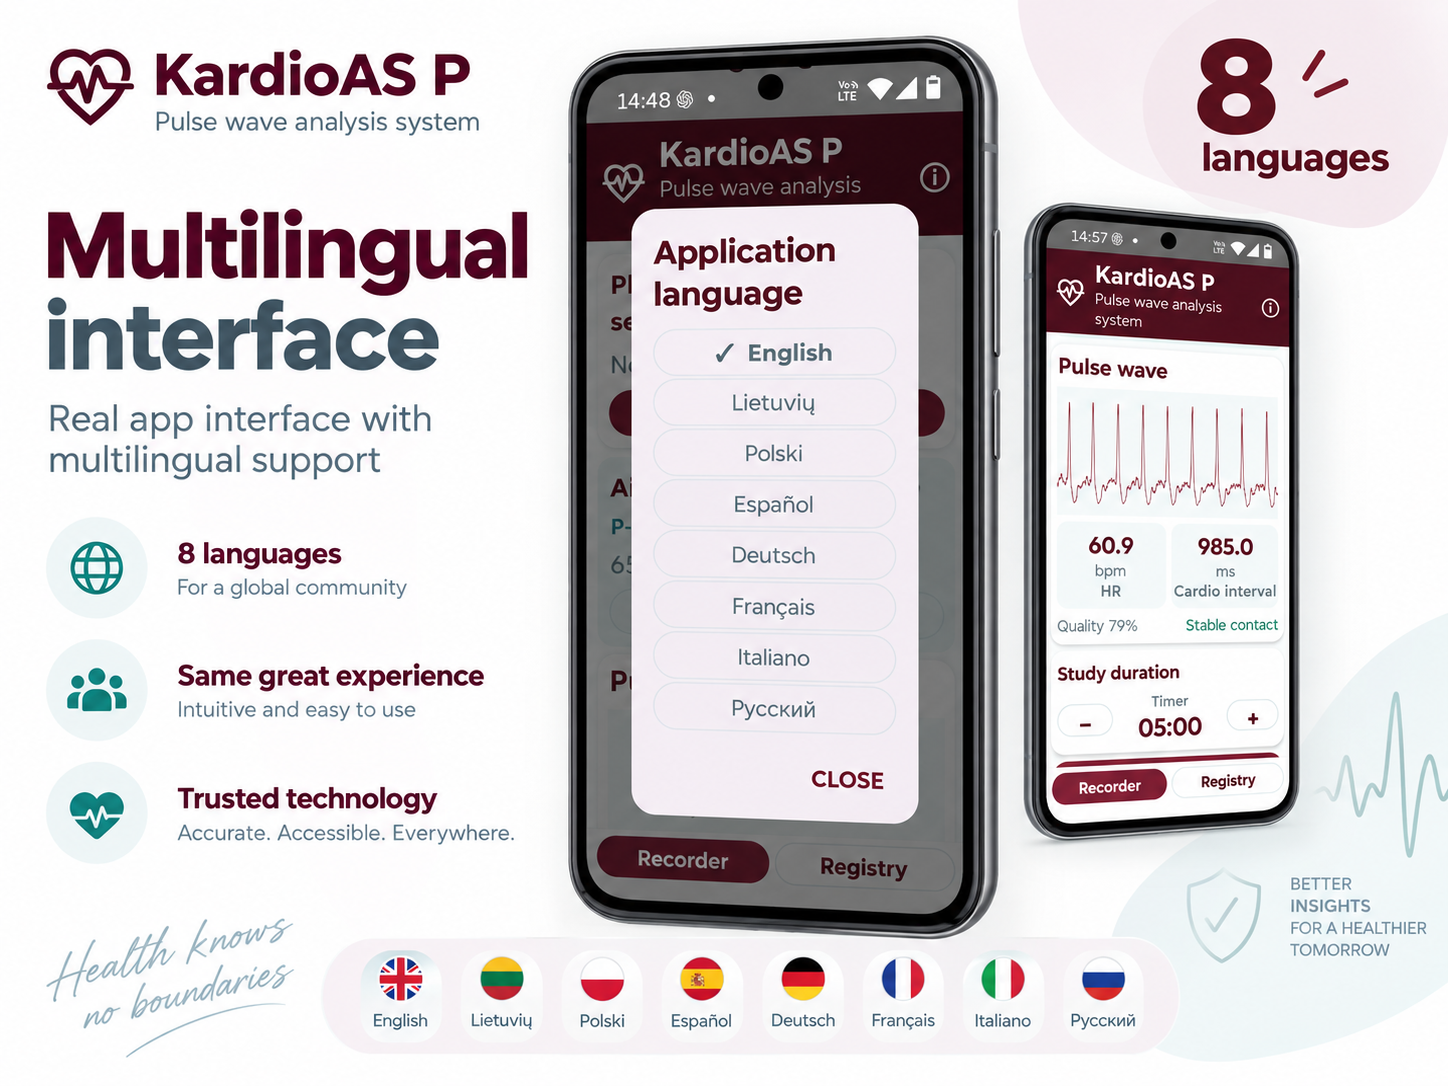
English, Lietuvių, Polski, Español, Deutsch, Français, Italiano and Русский — switchable inside the application.
KardioAS P is valuable precisely because it does not duplicate ECG. It examines the peripheral pulse — the vascular waveform that reaches the finger — while ECG examines the heart's electrical activity.
Screening is not diagnosis. PPG can reveal pulse irregularity patterns, but suspected rhythm disturbances should be confirmed with ECG/Holter when clinically indicated. PRV and ECG-derived HRV are related but not interchangeable.
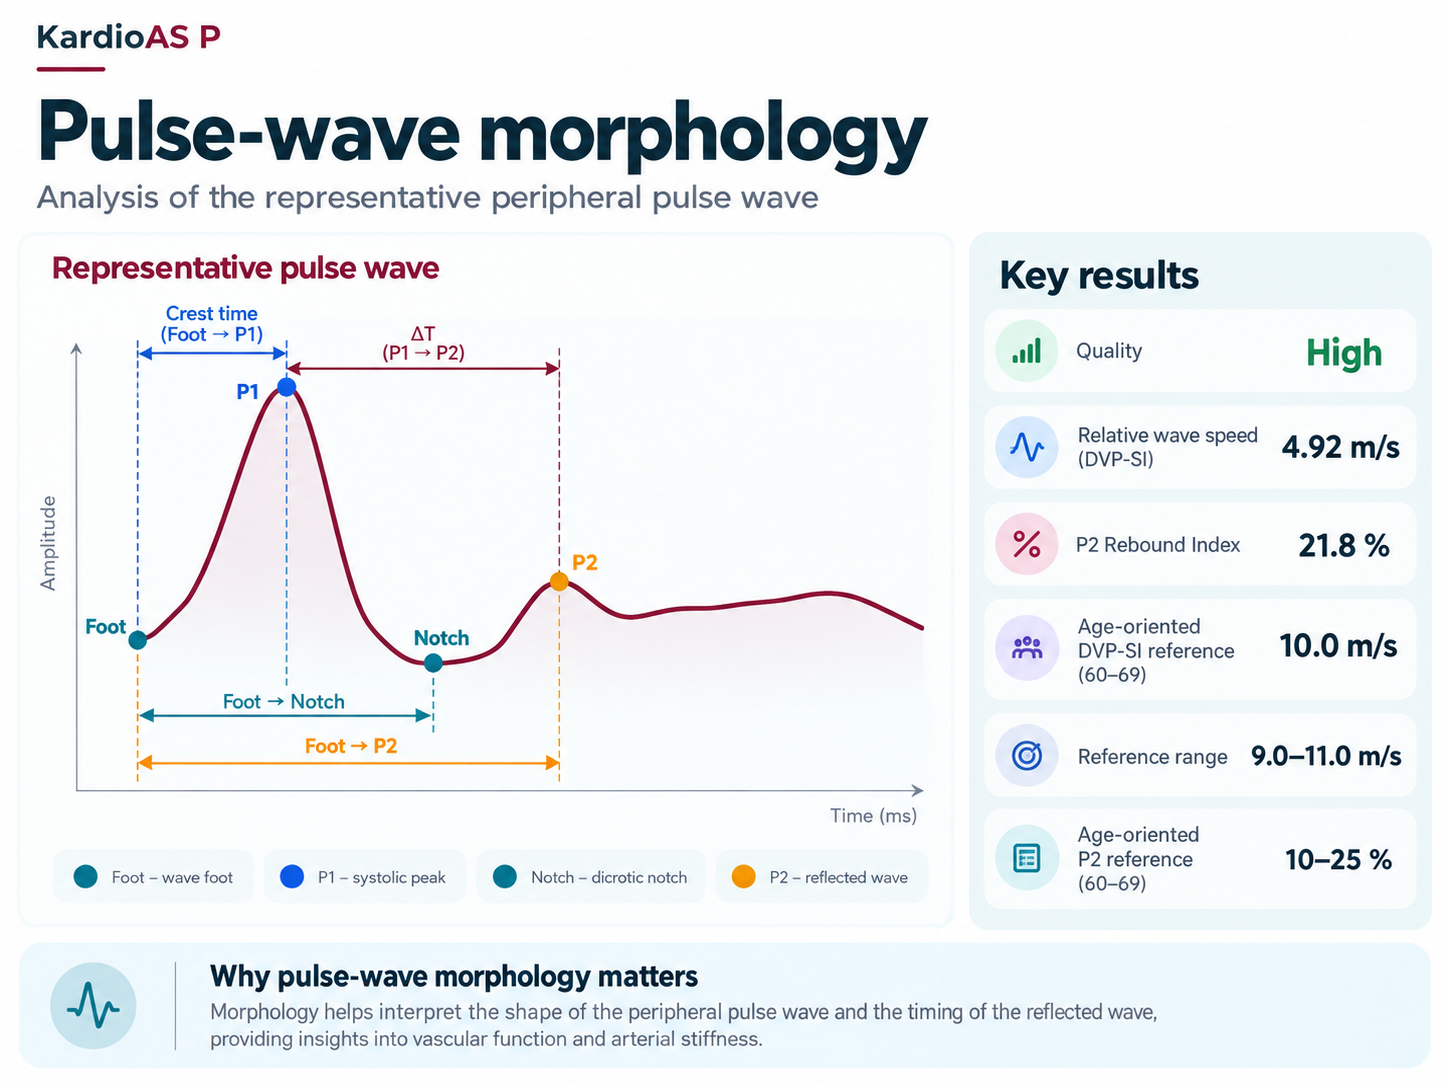
KardioAS P aligns and filters multiple accepted pulse cycles to construct a representative peripheral wave. The software then identifies characteristic landmarks and timing relationships rather than reducing the recording to heart rate alone.
The analytical report can include crest time, ΔT, Foot→incisura, Foot→P2, notch level, DVP-SI and P2 Rebound with age-oriented reference context. These are screening-oriented peripheral indices, not direct measurements of arterial PWV.
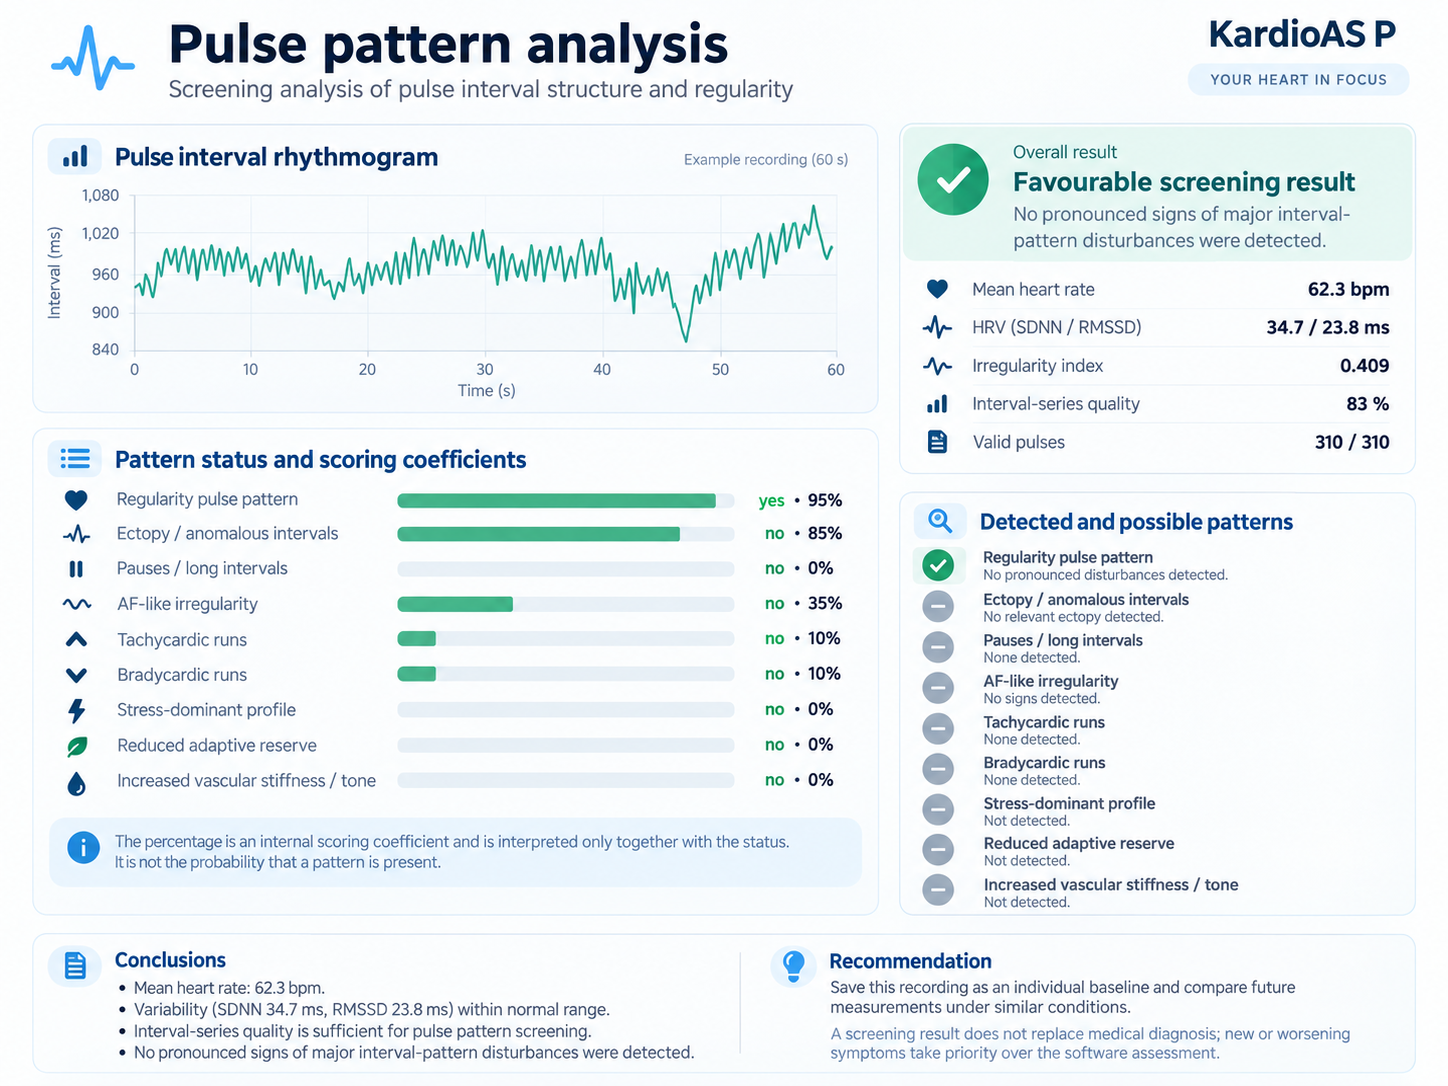
The pulse-pattern module evaluates the PPI series for regularity, anomalous intervals, long intervals, pronounced irregularity, tachycardic or bradycardic sequences and broader functional patterns. It also reports data quality so the interpretation is not separated from the recording conditions.
The software's scoring coefficient is interpreted together with the rule status. It is not presented as the probability that a disease or rhythm disorder is present.
KardioAS P keeps conventional variability measures alongside functional and exploratory modules so the user can review the same study from more than one angle without losing the original pulse context.
SDNN, RMSSD, pNN50, Poincaré, spectral power, VLF/LF/HF and related variability metrics from cleaned PPI.
Functional indices for regulatory load, adaptive reserve, fatigue, vascular tone/stiffness models and integrated context.
Indirect reconstruction of respiratory modulation from PRV, including estimated rate, RSA dynamics, spectrum and time–frequency view.
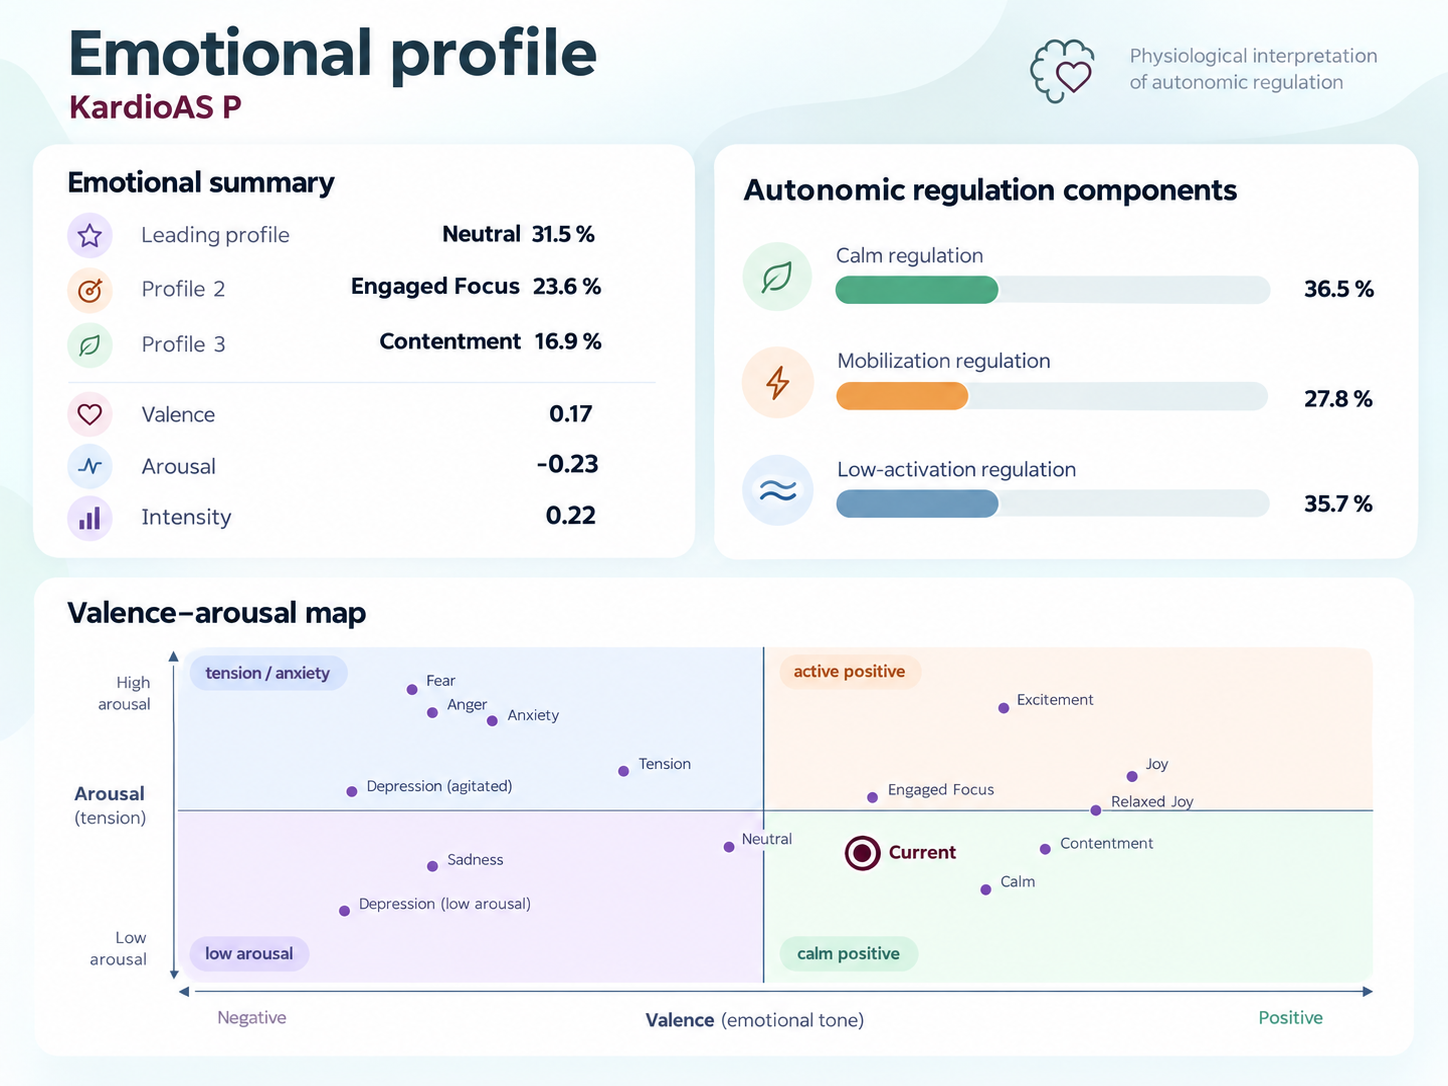
Physiological interpretation of autonomic regulation with valence/arousal mapping and ranked software-derived profiles.
Follow selected parameters over time and compare repeated studies under similar conditions.
Generate a multi-section PDF-style analytical report and share/export study results when needed.
The emotional module is explicitly a software estimate of autonomic-emotional tendencies. It combines regulation components with a valence–arousal map and ranked profiles, which can be useful for controlled observation and repeated measurements.
It is not a psychological or psychiatric diagnosis and does not infer thoughts, intentions or subjective experience.
Traditional Ayurvedic and Chinese pulse examinations historically focus on the peripheral pulse rather than the heart's electrical signal. KardioAS P also starts from a peripheral pulse, but measures it optically at the finger and analyzes it algorithmically. That creates an interesting bridge for exploratory interpretation — without claiming that PPG digitally reproduces traditional pulse diagnosis.
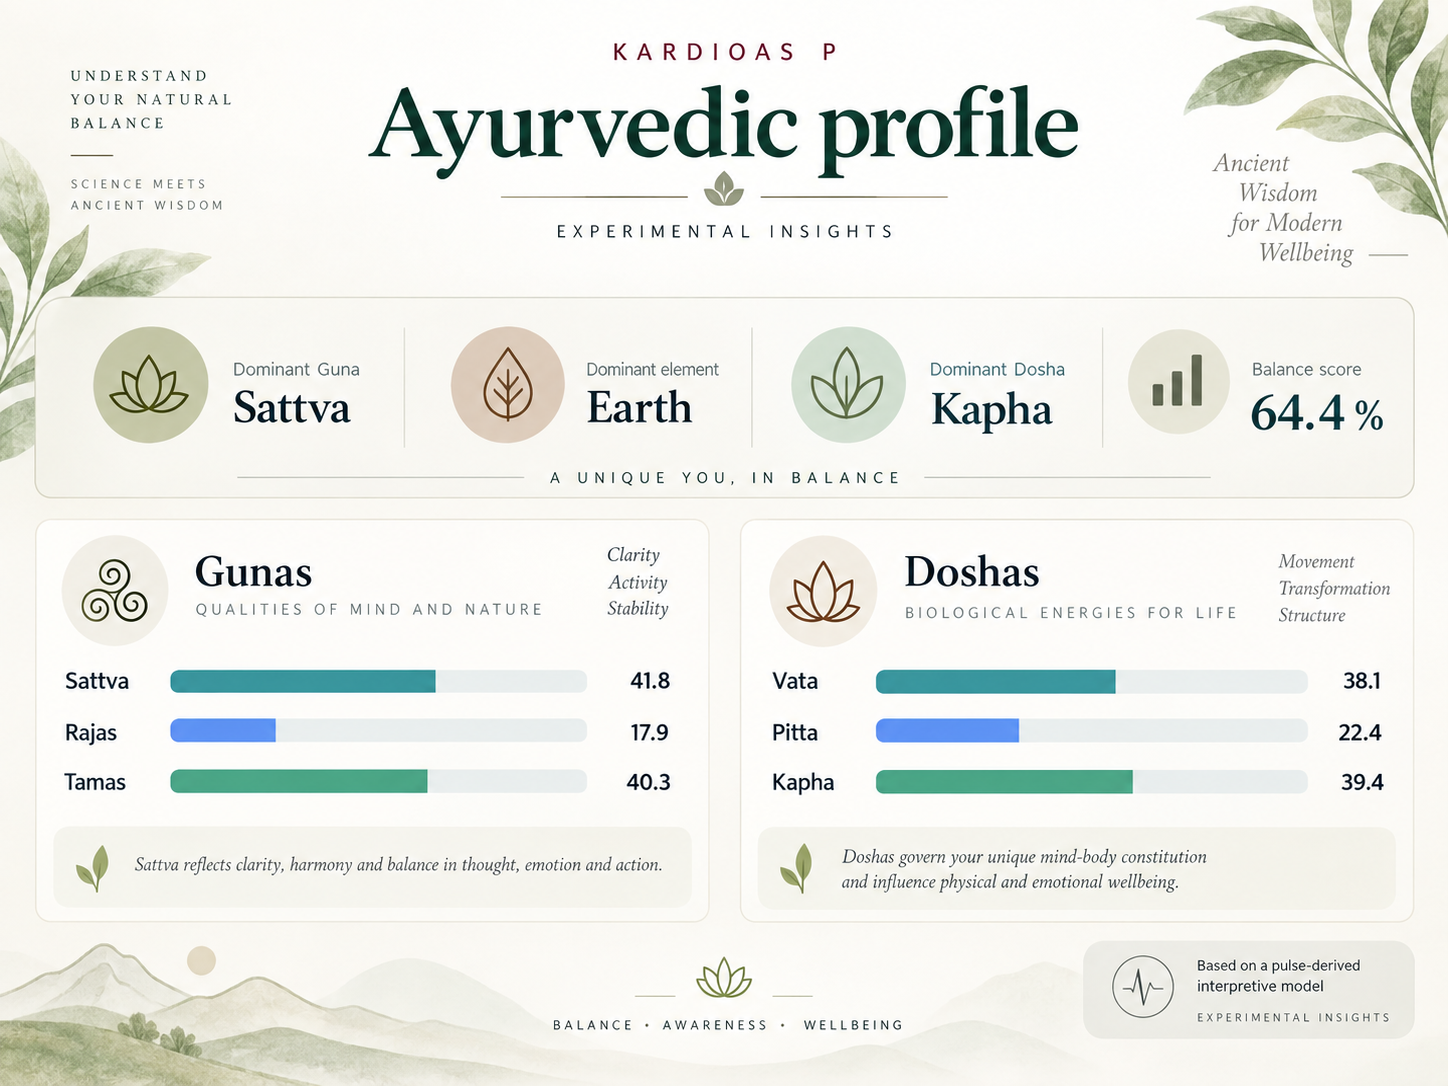
Pulse-derived patterns can be mapped into an exploratory Guna / element / Dosha presentation. The module is designed as an interpretive layer, not a clinical or traditional diagnostic substitute.
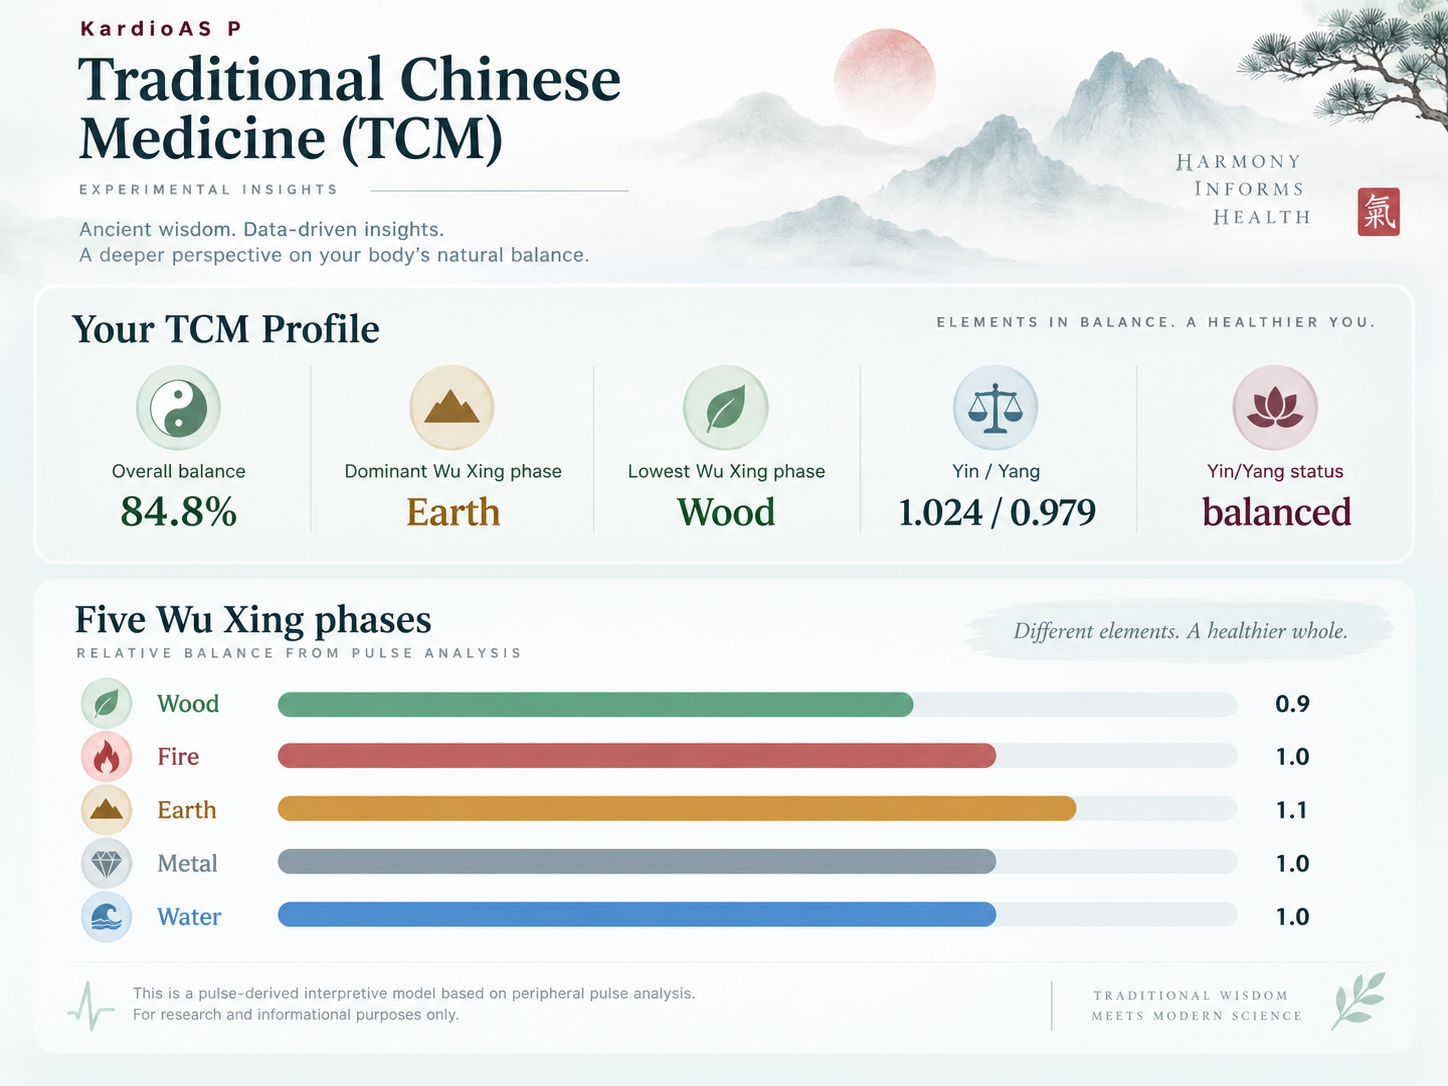
The system can present Yin/Yang and Wu Xing balance models derived from pulse-related metrics, making the numerical analysis easier to explore through a traditional conceptual vocabulary.
KardioAS P is built around saved patient studies rather than transient dashboard values. Re-open a recording, compare two sessions, follow selected parameters in trends and preserve the analytical context in a structured report.
KardioAS P is a peripheral pulse-analysis system. The questions below clarify what it measures, where it is useful and where ECG or clinical evaluation remains necessary.
No. It is a PPG system. It optically measures peripheral blood-volume pulses at the finger. ECG records the electrical activity of the heart. The two signals answer different questions and can be complementary.
No. PRV is calculated from pulse-to-pulse intervals, while classical HRV is based on ECG R–R intervals. In calm resting conditions they can be close, but they are not physically identical and may diverge under motion, vascular changes or other conditions.
KardioAS P can flag screening patterns such as pronounced irregularity or abnormal interval structure, but PPG does not replace ECG confirmation. Persistent or symptomatic rhythm concerns should be assessed with ECG/Holter and professional medical evaluation.
Two recordings can have a similar heart rate but different peripheral wave shapes. Morphology adds information about systolic rise, dicrotic structure, reflected-wave timing and the shape consistency of repeated pulse cycles.
They are experimental interpretive models derived from PPG/PRV features. They are intended for exploratory and research-oriented viewing of peripheral pulse patterns and are not clinical diagnoses or replacements for traditional practitioner assessment.
The recorder supports an adjustable study timer; a 5-minute session is a practical standard for many variability analyses. Stable, quiet conditions are more important than simply making the recording longer.
Yes. Studies can be saved to a patient registry, reopened, compared before/after and followed through trend and calendar views. Repeating measurements under similar conditions makes longitudinal interpretation more meaningful.
English, Lithuanian, Polish, Spanish, German, French, Italian and Russian.
Ask about system availability, the sensor workflow, research use, licensing or collaboration.